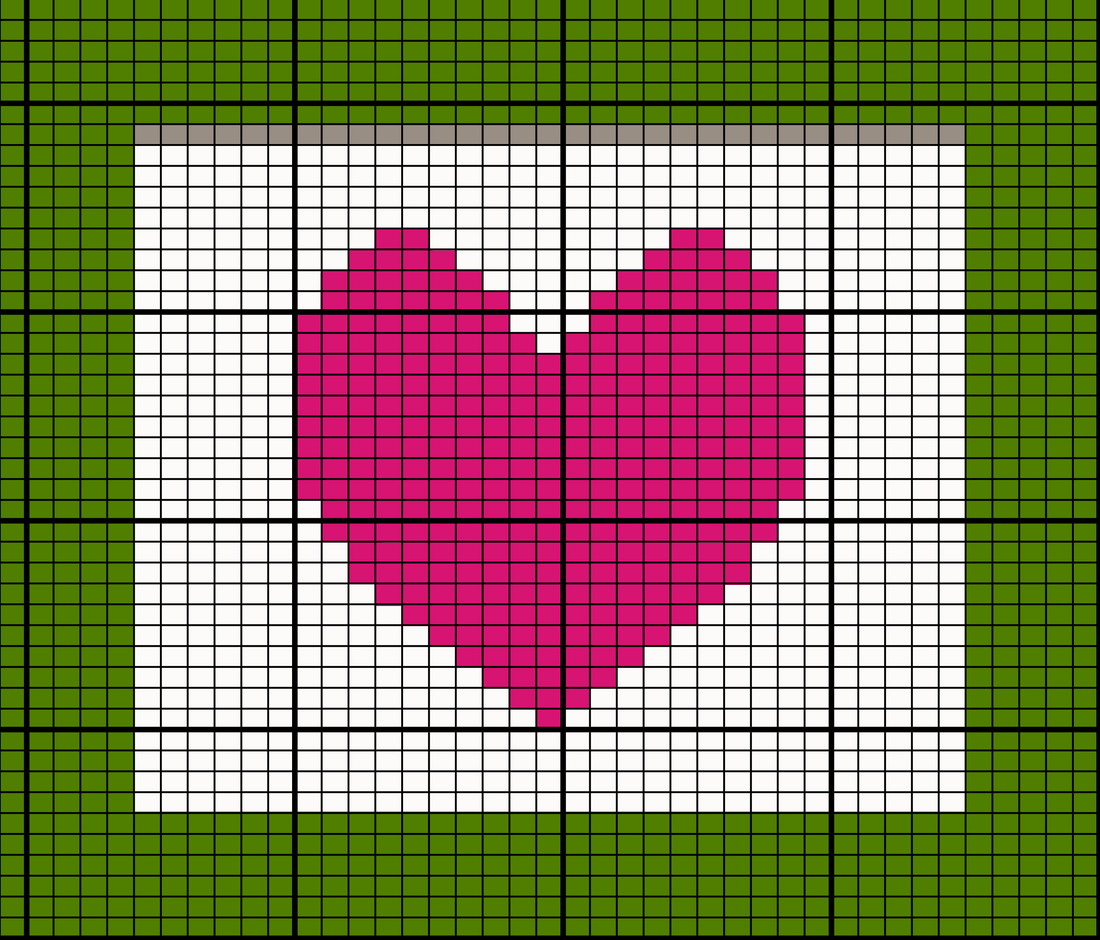
All my patterns come with a chart
A chart is represented in the form of a grid. In each frame you have 10 squares x 10 squares.
10 squares horizontally = 10 stitches
10 squares vertically = 10 rows
On the right side of the chart you have the number of each odd row.
These odd rows are Right Side
These rows are read from right to left.
On the left side of the chart you have the number of each even row.
These even rows are Wrong Side
These rows are read from left to right.
At the bottom of the chart, you have the numbers of each stitch from 5 to 5.
Borders are shown all around the chart.
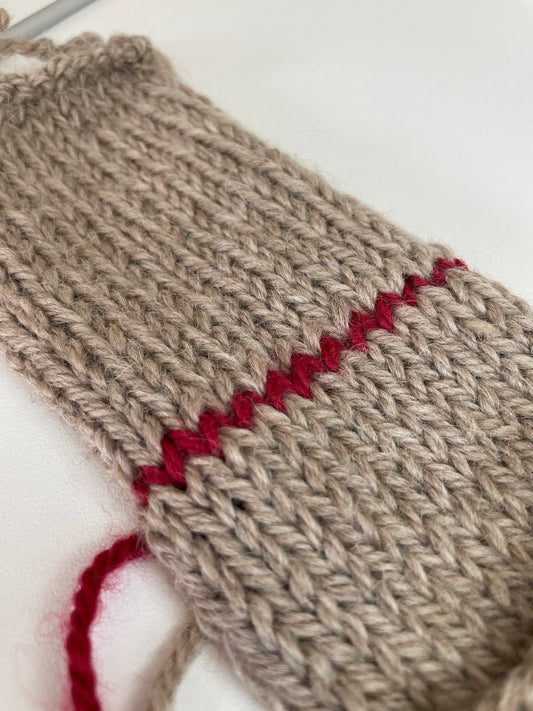
The grey row at the top of the chart before the top border represents the transition row. To learn more about this rank, click here.